Application and Exploration of Intelligent Technology for carbon dioxide transportation pipelines under the dual carbon background(Part 2)
3.1.2 Wavelet Neural Network (WNN)
WNN is a combination of wavelet basis functions (Morlet) based on the structure of BPNN, which combines wavelet transform with the strong robustness of ANN. Based on multi-resolution and time-frequency locality functions, it minimizes the probability of local extremum occurrence in the model, achieving good fault tolerance and approximation ability.WNN is also combined with intelligent algorithms to optimize unknown parameters in the model, further reducing the probability of falling into extreme values and improving prediction accuracy.
Chen Youzhou and others selected data from the XXX mileage and XX period of the subway tunnel for analysis. The first 43 periods of data were used as learning data, and the last 11 periods of data were used as prediction data to establish an artificial bee colony algorithm (ABC)+WNN subway tunnel surface subsidence prediction model. The ABC parameters were set as follows: the number of food sources was set to 20, the maximum number of food source cycles was set to 50, and the number of termination cycles was set to 50.Establish an artificial bee colony wavelet neural network model using MATLAB and make predictions, with a maximum relative error of ≤ 2.5×10⁻⁵.
Zheng Junbao et al. established a hybrid frog leaping algorithm (SFLA)+WNN model to predict short-term traffic flow. They imported the traffic flow dataset and preprocessed it, normalized the dataset using Mapmin max function, initialized the parameters using a combination of model and algorithm, and calculated the evaluation indicators through cross grouping method to obtain the prediction results.
3.1.3 Radial Neural Network (RBFNN)
RBFNN has a simpler calculation process, shorter time, and no reverse calculation compared to BPNN.Chen Chong et al. selected detection parameters such as moisture content, HCO3- content, Cl- content, SO42- content, redox potential, pH value, and soil resistivity as input variables to obtain 87 sets of sample data. Among them, 60 sets were used as training samples to establish a principal component analysis (PCA)+RBFNN buried pipeline corrosion rate prediction model, and the remaining 27 sets were used as test samples. Multiple linear regression (MLR) and backpropagation neural network (BPNN) were also established for comparison. The results showed that using RBFNN had higher prediction accuracy, with an average relative error reduced from 14.33% to 9.27%.
In addition, the generalized regression neural network (GRNN) introduced by modifying the RBFNN network structure has better prediction performance for small samples. However, currently the smoothness factor parameters in GRNN are mainly selected manually, which results in poor accuracy and low efficiency. To obtain the optimal GRNN prediction model, it is necessary to introduce optimization parameters such as particle swarm optimization (PSO) algorithm.
Luo Zhengshan et al. proposed a rough set (RS) algorithm+particle swarm optimization (PSO) algorithm+GRNN to establish a soil corrosion prediction model. For example, 10 main soil corrosion evaluation indicators (water content, salt content, pH value, potential gradient, redox potential, pipeline potential, stray potential, resistivity, sulfate content and chloride ion content, etc.) were selected from buried pipelines in China and Russia. The annual average corrosion wall thickness was taken as the evaluation target, and a soil corrosion index system was constructed to obtain relevant monitoring data.According to the principle of RS attribute reduction, programming on the MATLAB platform, the analysis results can obtain the main soil factors affecting pipeline corrosion. 35 sets of core indicator datasets were obtained from the reduced indicators. 25 sets were randomly selected as the training set and fed into the RS+PSO+GRNN model for training, while the remaining 10 sets were used as the testing set. The result shows that the corrosion level prediction accuracy of the model is ≥90%, which effectively evaluates the corrosion level of pipelines and makes the evaluation results more reliable.
3.1.4 Comparison of Artificial Neural Network Technologies
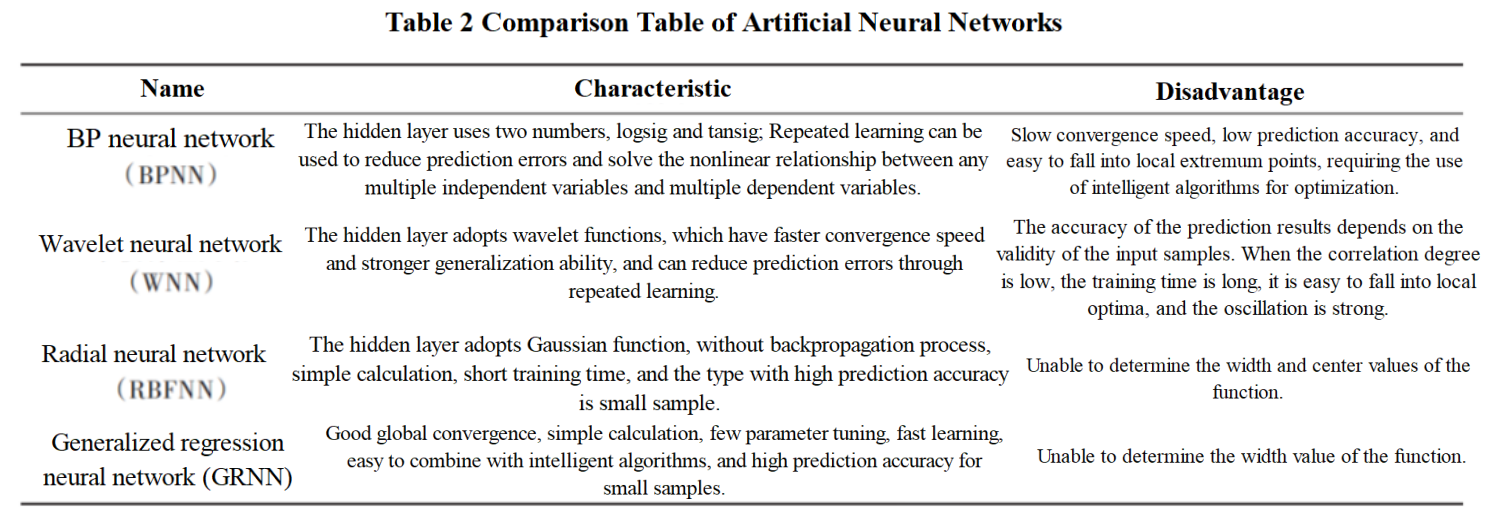
In summary, a comparative analysis of the four types of ANN is conducted from two aspects: characteristics and disadvantages, as shown in Table 2.

3.2 Distributed Fiber Optic Positioning Technology
Fiber optic sensing technology is a monitoring technology that uses light waves as carriers and optical fibers as media, and utilizes fiber Bragg gratings to respond to changes in the surrounding environment to obtain scattered light signals, thereby accurately locating signal mutation sites.In a fiber optic sensing system, the light source provides a carrier for the fiber optic sensor, and the light emitted by the light source is transmitted through the fiber optic cable. Due to the nonlinear effect of the fiber optic cable itself, backscattered light is generated on the fiber optic path of the optical transmission. At a certain position of the fiber optic cable, it is affected by external physical factors (temperature, strain, vibration, etc.), and the backscattered light wave parameters inside (light intensity, wavelength, phase, etc.) are modulated, becoming a modulated optical signal. The modulated light wave parameters are detected by a photodetector to obtain the measured external physical quantity. This technology has been applied in projects such as long-distance oil and gas pipelines.
When there is a local leakage during CO2 pipeline transportation, the released high-pressure CO2 has multiple effects on the local environment, such as temperature drop and vibration, which will be reflected in the fiber optic sensing signal.Compared with long-distance oil and gas pipelines, the temperature field distribution changes caused by CO2 leakage are more obvious. Distributed fiber optic temperature sensors laid along the outer wall of the pipeline can continuously monitor temperature changes. When the temperature change exceeds the threshold range, it can be judged that the pipeline has leaked, which is conducive to accurate positioning of the leakage point.In addition, by using distributed fiber optic sensing technology and setting corresponding threshold signals, the occurrence locations of free water, slug flow, hydrates, etc. inside the pipeline can be determined, and the heat flow, micro vibration, and other signals on the outer wall of the pipeline can be obtained, providing reliable basis for on-site management and safety warning.
3.3 Feature Spectral Localization Technology
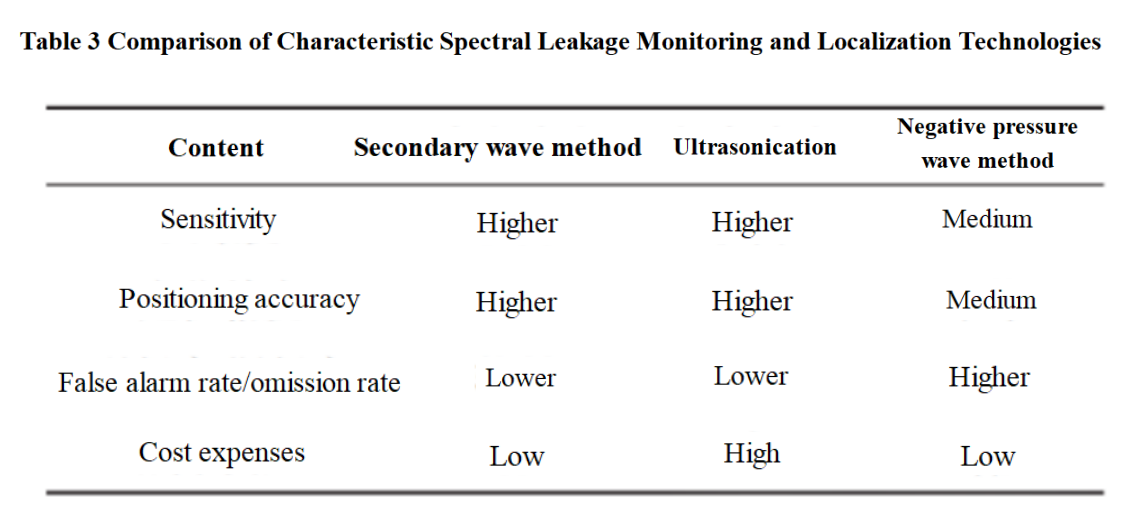
When a CO2 pipeline leaks, the CO2 fluid at the leak point forms turbulence and produces a leak sound under the pressure difference inside and outside the pipeline.The leakage sound signal is a continuous signal excited by the fluid, which includes leakage characteristic information such as the size of the leakage aperture, the shape and location of the damage. According to the different properties of sound waves, leakage sound wave monitoring methods are mainly divided into ultrasonic method and infrasonic method.
Ultrasonic method refers to locating the point with the highest ultrasonic intensity in the leaked sound wave. During the leakage monitoring process, a certain number of sensors need to be installed to prevent signal attenuation; Although this method has high sensitivity, it is only applicable for short distance leak location monitoring.
The infrasonic method refers to the calculation of the location of leakage points by combining the wave velocity and the time difference between the arrival of secondary wave signals at the first and last sensors. Due to the long wavelength and low frequency of infrasonic waves, environmental noise can affect them, but the attenuation is slow. Therefore, it is mainly used for long-distance leakage positioning monitoring.
In addition to acoustic wave method, negative pressure wave method is also a commonly used method for monitoring and locating pipeline leaks. When a pipeline leaks, the medium quickly sprays out due to the pressure difference between the inside and outside of the pipeline, and the pressure fluctuation caused by the instantaneous pressure drop at the leakage point is called a negative pressure wave. Calculate the location of the leakage point by combining the wave velocity of the negative pressure wave with the time difference between the sensors at the beginning and end of the pipeline.However, negative pressure waves are prone to false alarms due to pressure fluctuations, and small leaks during pipeline transportation are difficult to monitor (Table 3).

