Analysis of Pressure Drop Characteristics during Restart of Heavy Oil Water Ring Transportation Pipelines(Part 3)
2.3 Restart Pressure Drop Model
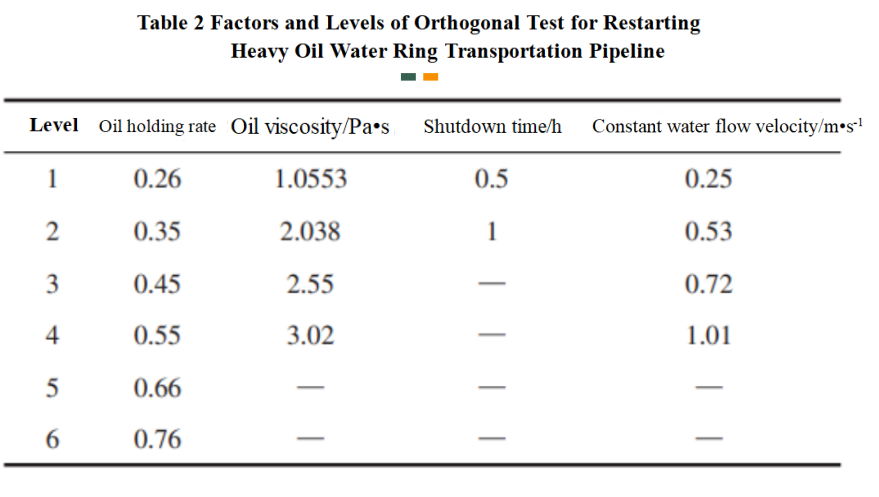
Through the above single factor analysis, it can be concluded that oil holdup, oil viscosity, shutdown time, and constant water flow rate all affect the magnitude of restart pressure drop in heavy oil water ring transportation pipelines. To further analyze the significance of different factors on the restart pressure drop, a four factor mixed level restart orthogonal experimental study was conducted, and the factors and levels are shown in Table 2. As shown in the table, there are six levels of oil holdup, two levels of shutdown time, and four levels of oil viscosity and constant water flow velocity.

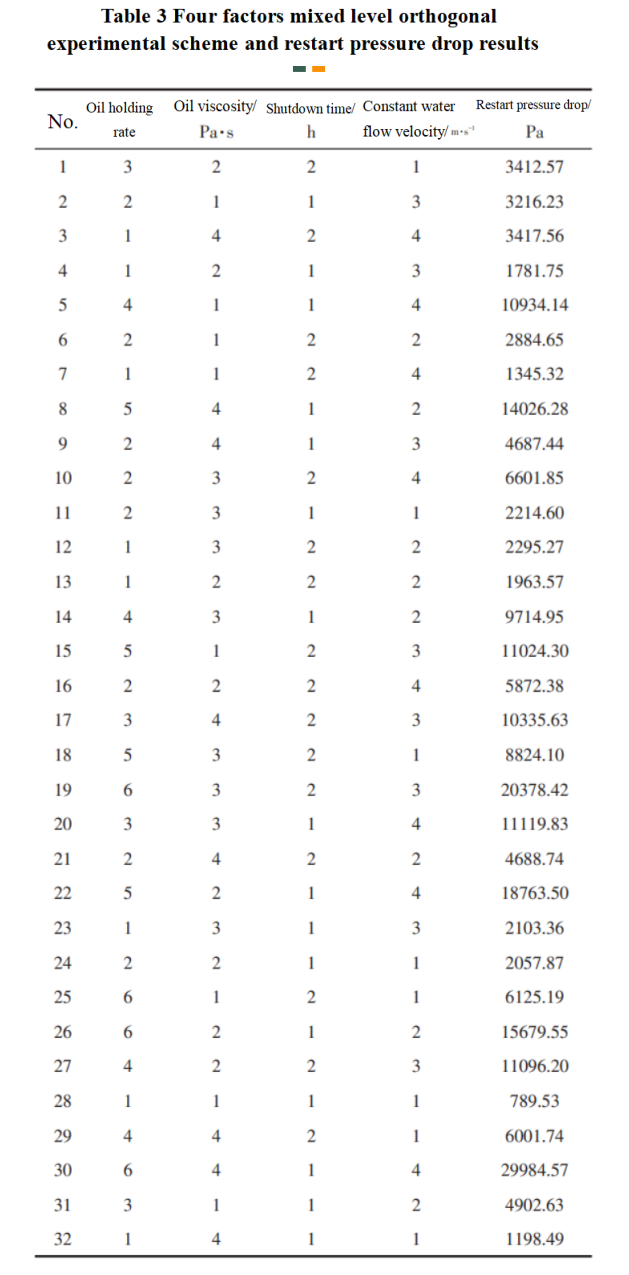
Design a restart experimental plan based on the principle of orthogonal experiment, which is to establish an orthogonal table with a four factor mixed level L32 (61 × 21 × 42). The restart orthogonal experimental plan and restart pressure drop test results are shown in Table 3. On this basis, regression analysis was conducted on 32 sets of orthogonal experimental data using IBM SPSS software to explore the significant impact of each factor on restart pressure drop and its quantitative relationship with restart pressure drop.

To evaluate the significant impact of the above four factors on the restart pressure drop of heavy oil water ring transportation pipelines, IBM SPSS software was used to perform variance analysis on the orthogonal restart experimental data. By comparing the F value and Sig. value, the significance of the impact of each factor was determined. Table 4 shows the analysis of variance results of the orthogonal restart experiment for heavy oil water ring transportation pipelines. From this, it can be seen that the influence of oil holding rate and constant water flow velocity on the restart pressure drop of heavy oil water ring transportation pipelines is extremely significant, and the relationship is also the closest; The influence of oil viscosity on restart pressure drop is more significant, but it is second to oil holding rate and constant water flow velocity; The shutdown time also has a certain impact on the restart pressure drop, but it is relatively weak compared to other factors. Therefore, oil holding rate and constant water flow rate are the main factors, while oil viscosity and shutdown time are secondary factors. The order of significance of the impact of each factor on restart pressure drop from large to small is oil holding rate>constant water flow rate>oil viscosity>shutdown time.

Given that the four factors that affect the restart pressure drop have different ranges of values and measurement units, in order to eliminate the differences in order of magnitude and dimension among the factors and reduce the fitting error of the nonlinear regression model, the min max normalization method is applied to normalize the original data. This method involves performing a linear transformation on the original data, converting it into a 1-dimensional metric evaluation value, and mapping the data values to between [0, 1]. The conversion formula is shown in equation (3).
.png)
According to the range of values for various influencing factors of restart pressure drop, the conversion formula for each influencing factor can be obtained by applying equation (3), as shown in equation (4).
.png)
Normalize the orthogonal experimental results of the factors affecting restart pressure drop, and combine the analysis of the impact of single factors on restart pressure drop to establish a multiple nonlinear regression model for predicting restart pressure drop, as shown in equation (5).
.png)
Apply SPSS statistical software to fit a nonlinear regression model and test the model and its correlation coefficients. Due to the maximum relative reduction between the sum of squares of continuous residuals being SSCON=1.000×10⁻⁸, the operation stopped after 49 model evaluations and 21 derivative evaluations. The determination coefficient R2 (R2=1- sum of squared residuals/sum of squared corrections) of the obtained nonlinear regression model is 0.995, which is very close to 1, indicating that the model has a high degree of goodness of fit and a good fit to the orthogonal experimental data. Therefore, by iterative calculation, the optimal estimation value of the nonlinear regression coefficients can be obtained. By substituting the specific values of each coefficient into equation (5), a multivariate nonlinear regression model for the pressure drop of the heavy oil water ring transportation pipeline after shutdown and restart can be obtained, as shown in equation (6).
.png)
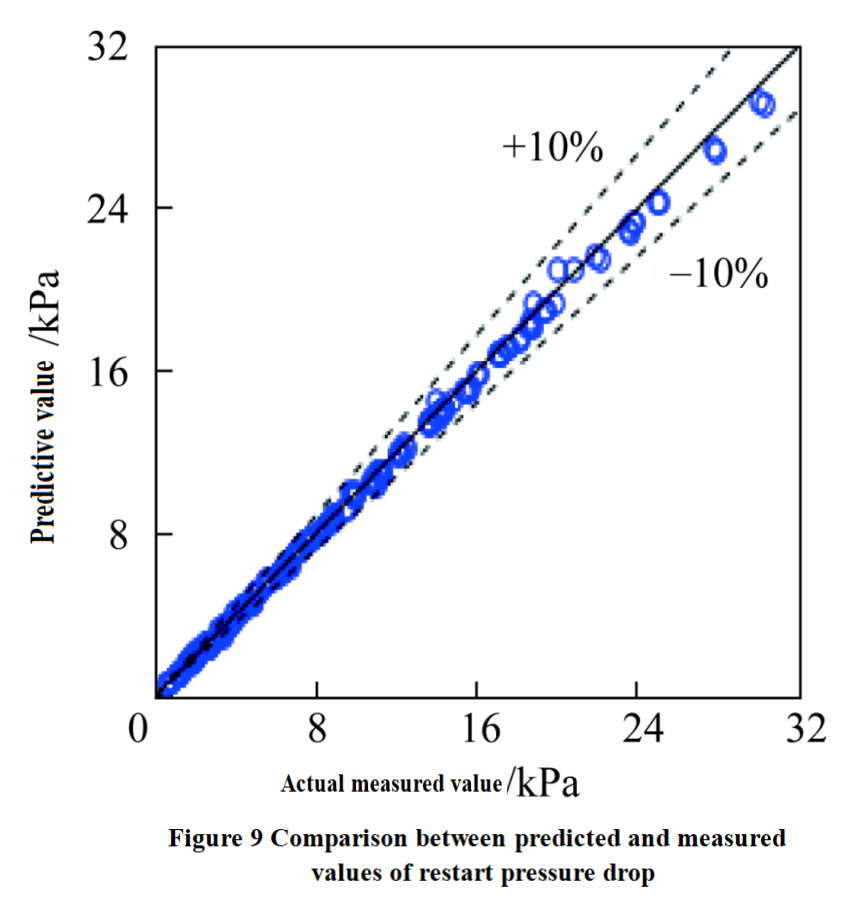
Based on the experimental measurement of the pressure drop during the shutdown and restart of the heavy oil water ring transportation pipeline mentioned above (see section 2.2) and regression model fitting (see section 2.3), the measured and predicted values of the restart pressure drop in 192 sets under different experimental conditions were compared, and the relative error between the two was analyzed [Equation (2)], as shown in Figure 9. From the graph, it can be seen that the predicted values of the restart pressure drop model have a high degree of conformity with the experimental measurement values, with relative errors δΔp within the range of ±10%. It can be seen that the established multiple nonlinear regression model for restart pressure drop has a good overall fitting effect on the experimental data.

Furthermore, according to the analysis of equation (6), it can be concluded that the restart pressure drop Δpmax increases correspondingly with the increase of oil holding rate Ho, showing a quadratic trend. Moreover, as the oil holding rate increases, the increase in restart pressure drop becomes more and more significant; The restart pressure drop Δpmax increases exponentially with the oil viscosity μo, the shutdown time tst, and the constant water flow velocity Ucl. That is, as the viscosity of the oil, the shutdown time, and the constant water flow velocity increase, the restart pressure drop increases. However, the larger the viscosity of the oil, the shutdown time, and the constant water flow velocity, the slower the increase in restart pressure drop.
3. Conclusions
(1). The self-developed indoor loop experimental system is suitable for analyzing the characteristics of the restart process and predicting the restart pressure drop of heavy oil and water loop transportation pipelines.
(2). During the restart process of the heavy oil water ring transportation pipeline at a constant water flow rate after shutdown, there is an initial peak in the restart pressure drop that varies over time. Overall, it can be divided into two stages: pressure drop attenuation and pressure drop equilibrium.
(3). Based on the four factor mixed level orthogonal restart experimental data, a multiple nonlinear regression model for restart pressure drop was established using SPSS software. The predicted values of the model were in high agreement with the measured values of 192 single factor experiments, with relative errors all within ± 10%.
(4). As Ho, μo, tst and Ucl increase, Δpmax shows a monotonic increasing trend; The larger Ho, the greater the increase in Δpmax, but the larger μo and Ucl, the smaller the increase in Δpmax; The impact of tst on Δpmax is relatively small, and as tst increases, Δpmax shows a slightly increasing trend. Therefore, for pipelines that may be shut down due to planned maintenance, routine maintenance, or malfunctions in practical applications, it is necessary to control the appropriate oil holding rate during normal operation, control the reasonable shutdown time during shutdown, take effective measures to reduce oil viscosity before restarting, and select a moderate constant water flow rate during restart to reduce the peak pressure drop during restart, which is conducive to achieving smooth restart of heavy oil water ring transportation pipelines after shutdown.
